



Charder's Body Composition Analyzers provide detailed measurements for body water, fat, muscle, cellular health, and more! Data is arranged clearly on easy-to-interpret result sheets, suitable for different application needs.

  • Medical Result Sheet
  • Standard Result Sheet
  • Child Result Sheet
  • Fitness Result Sheet
  • Advanced Fitness Result Sheet

Medical Result Sheet

Available on MA801

  • (1) Body Composition Analysis

    Reliable, non-invasive Bioelectrical Impedance Analysis makes it easier to conduct regular monitoring of Body Composition. The calculated estimated weights of the body's compositional elements (including Intracellular Water, Extracellular Water, Protein, Minerals) can be compared with standard results for context.

  • (2) Muscle-Fat Analysis

    Measurement of weight is important, but incomplete without further analyzing the amount of muscle and fat in a client. Understanding skeletal muscle and body fat proportions can help trainers formulate muscle and fat control recommendations.

  • (3) Obesity Analysis

    Different body fat indicators provide valuable information needed for a more useful evaluation of health. Percent Body Fat is a general indicator, while Waist-Hip Ratio and Visceral Fat are used as critical cut-off points for risk of obesity-related diseases which may not be immediately visible from the outside.

  • (4) Total & Segmental Analysis

    Measure muscle and fat more precisely with segmental analysis of the trunk, upper body, and lower body. Identify imbalances, and determine if segmental muscle is within normal range, tracking changes to better observe the effects of rehabilitation or training.

Medical Result Sheet Available on MA801 Body Composition Analyzer
  • (5) Bioelectrical Vector Impedance Analysis (BIVA)

    Bioelectrical Vector Impedance Analysis (BIVA) uses direct measurements of reactance and resistance, allowing it to provide reliable comparisons and evaluations of cellular hydration and nutritional status - even for individuals with abnormal hydration - making it easier for practitioners to recommend detailed health checks if needed, helping to keep clients safe.

  • (6) Phase Angle

    Phase angle decreases with illness and old age, making it an important indicator of health, and an absolute necessity for a professional body composition evaluation. Compare phase angle with respective gender and age, placing results into context.

  • (7) Muscle Quality

    Track changes in quality, not just quantity! In elderly populations, muscle strength can decline much more rapidly than muscle mass. By evaluating muscle effectiveness through cellular estimation of grip strength health, professionals now have a more useful indicator that may provide early warning for fall risk.

  • (8) Body Fat Percentiles

    Compare body fat percentages with similar population, placing results in context of age, gender, and ethnicity. What's "normal" for a 20-year old doesn't necessarily apply to an 80-year old, and this module helps the subject better understand comparative results.

  • (9) Edema Index

    Identify abnormalities in intracellular/extracellular fluid proportion, using the edema index as an indicator and warning sign for diseases affecting body fluid balance, including impaired heart and function.

  • (10) Research Information

    The Medical Result Sheet provides a wide variety of body composition output parameters of particular relevance for research, and includes various indexes used as early warning signs for malnutrition, obesity, and sarcopenia.

    For more information, check out our video guide!
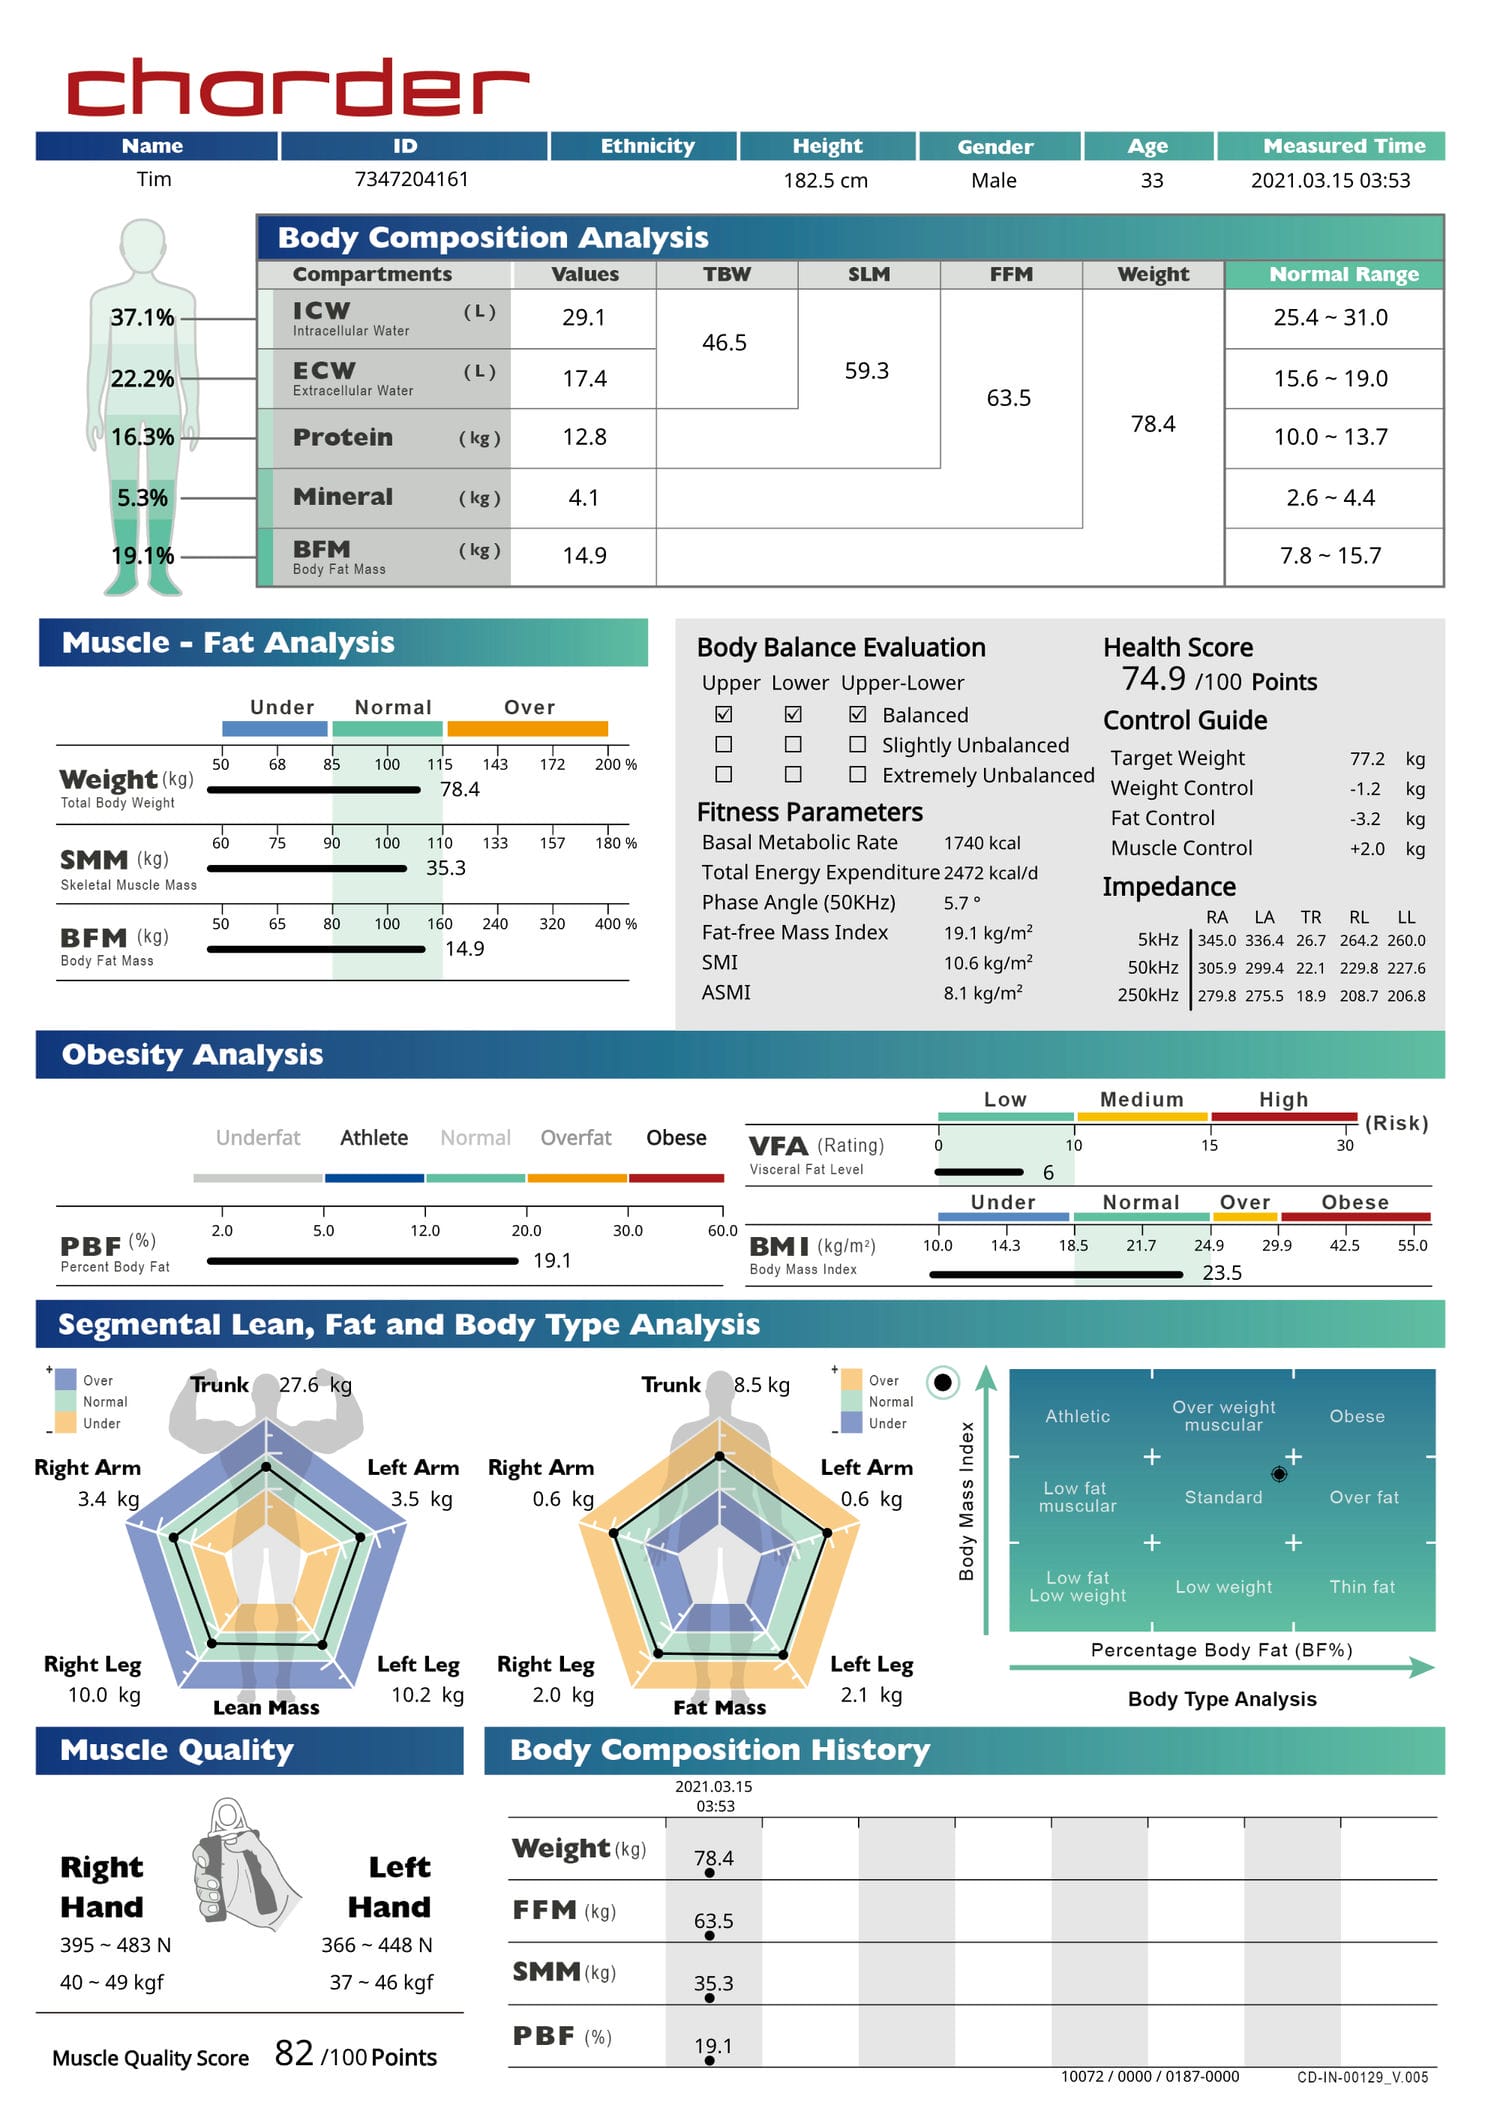
Standard Result Sheet

Available on MA601 and MA801

  • (1) Body Composition Analysis

    Reliable, non-invasive Bioelectrical Impedance Analysis makes it easier to conduct regular monitoring of Body Composition. The calculated estimated weights of the body's compositional elements can be compared with standard results for context.

  • (2) Muscle-Fat Analysis

    Measurement of weight is important, but incomplete without further analyzing the amount of muscle and fat in a client. Understanding skeletal muscle and body fat proportions can help trainers formulate muscle and fat control recommendations.

  • (3) Obesity Analysis

    The Standard Result Sheet categorizes body fat ranges into those commonly seen for Underfat, Athlete, Normal, Overfat, and Obese populations. With more precise ranges, fat control goals and progress can be tracked more accurately. Visceral Fat Level is related to Abdominal Visceral Fat Area, and is used as an indicator for risk of obesity-related diseases.

  • (4) Segmental Analysis

    Measure muscle and fat more precisely with segmental analysis of the trunk, upper body, and lower body. Identify imbalances, and determine if segmental muscle is within normal range, tracking changes to better observe the effects of rehabilitation or training.

Standard Result Sheet Available on MA601 Body Composition Analyzer
  • (5) Body Type Analysis

    The body type analysis chart combines BMI and Percent Body Fat to determine the subject's body type. Body composition changes needed to achieve ideal body type can be clearly determined using this clear and simple chart.

  • (6) Muscle Quality

    Track changes in quality, not just quantity! In elderly populations, muscle strength can decline much more rapidly than muscle mass. By evaluating muscle effectiveness through cellular estimation of grip strength health, professionals now have a more useful indicator that may provide early warning for fall risk.

  • (7) Body Composition History

    By selecting the same user ID prior to measurement, changes in body composition can be tracked automatically (Weight, Fat-Free Mass, Skeletal Muscle Mass, and Percent Body Fat).

  • (8) Fitness Parameters

    The Standard Result Sheet provides multiple body composition output parameters of particular relevance for fitness, and includes various indexes used as early warning signs for malnutrition and sarcopenia. Make use of Phase Angle for evaluation of cellular health, and analyze health status in more detail.

  • (9) Health Score

    The Result Sheet provides normal ranges for a variety of output, as well as an overall health score that takes into account a combination of results.

  • (10) Control Guide

    The Control Guide calculates a recommended amount of muscle and fat control in order to reach an ideal, healthy body type. This can be used as a general reference for a "standard" body type, though subjects can of course choose to use their own goals and calculations instead.

    For more information, check out our video guide!

Child Result Sheet

Available on MA601 & MA801

  • (1) Body Composition Analysis

    Reliable, non-invasive Bioelectrical Impedance Analysis makes it easier to conduct regular monitoring of Body Composition. The calculated estimated weights of the body's compositional elements can be compared with standard results for context.

  • (2) Muscle-Fat Analysis

    Measurement of weight is important, but incomplete without further analyzing the amount of muscle and fat in a child. Understanding skeletal muscle and body fat proportions can help professionals evaluate child growth, and provide recommendations.

  • (3) Obesity Analysis

    The child result sheet organizes common obesity-related metrics here into Under, Normal, Over, and Obese categories. Normal range will adjust according to the child's age.

  • (4) Growth History

    By selecting the same user ID prior to measurement, growth trends can be tracked automatically (Height, Weight, BMI, Skeletal Muscle Mass, and percentiles)

Child Result Sheet Available on MA601 & MA801 Body Composition Analyzer
  • (5) Growth Chart

    The child's height and BMI results are compared with results from the same age to place results in context. Results in the 3rd percentile are a potential sign of malnutrition or delayed growth, and we recommend a more detailed health check-up.

  • (6) Evaluation & Recommendations

    Based on body composition and growth results, the result sheet will provide an evaluation and recommendations for nutrition and exercise. Results should be considered a general reading, and not for diagnostic purposes.

  • (7) Research Information

    The result sheet provides a variety of body composition output parameters of particular relevance for research.


    For more information, check out our video guide!
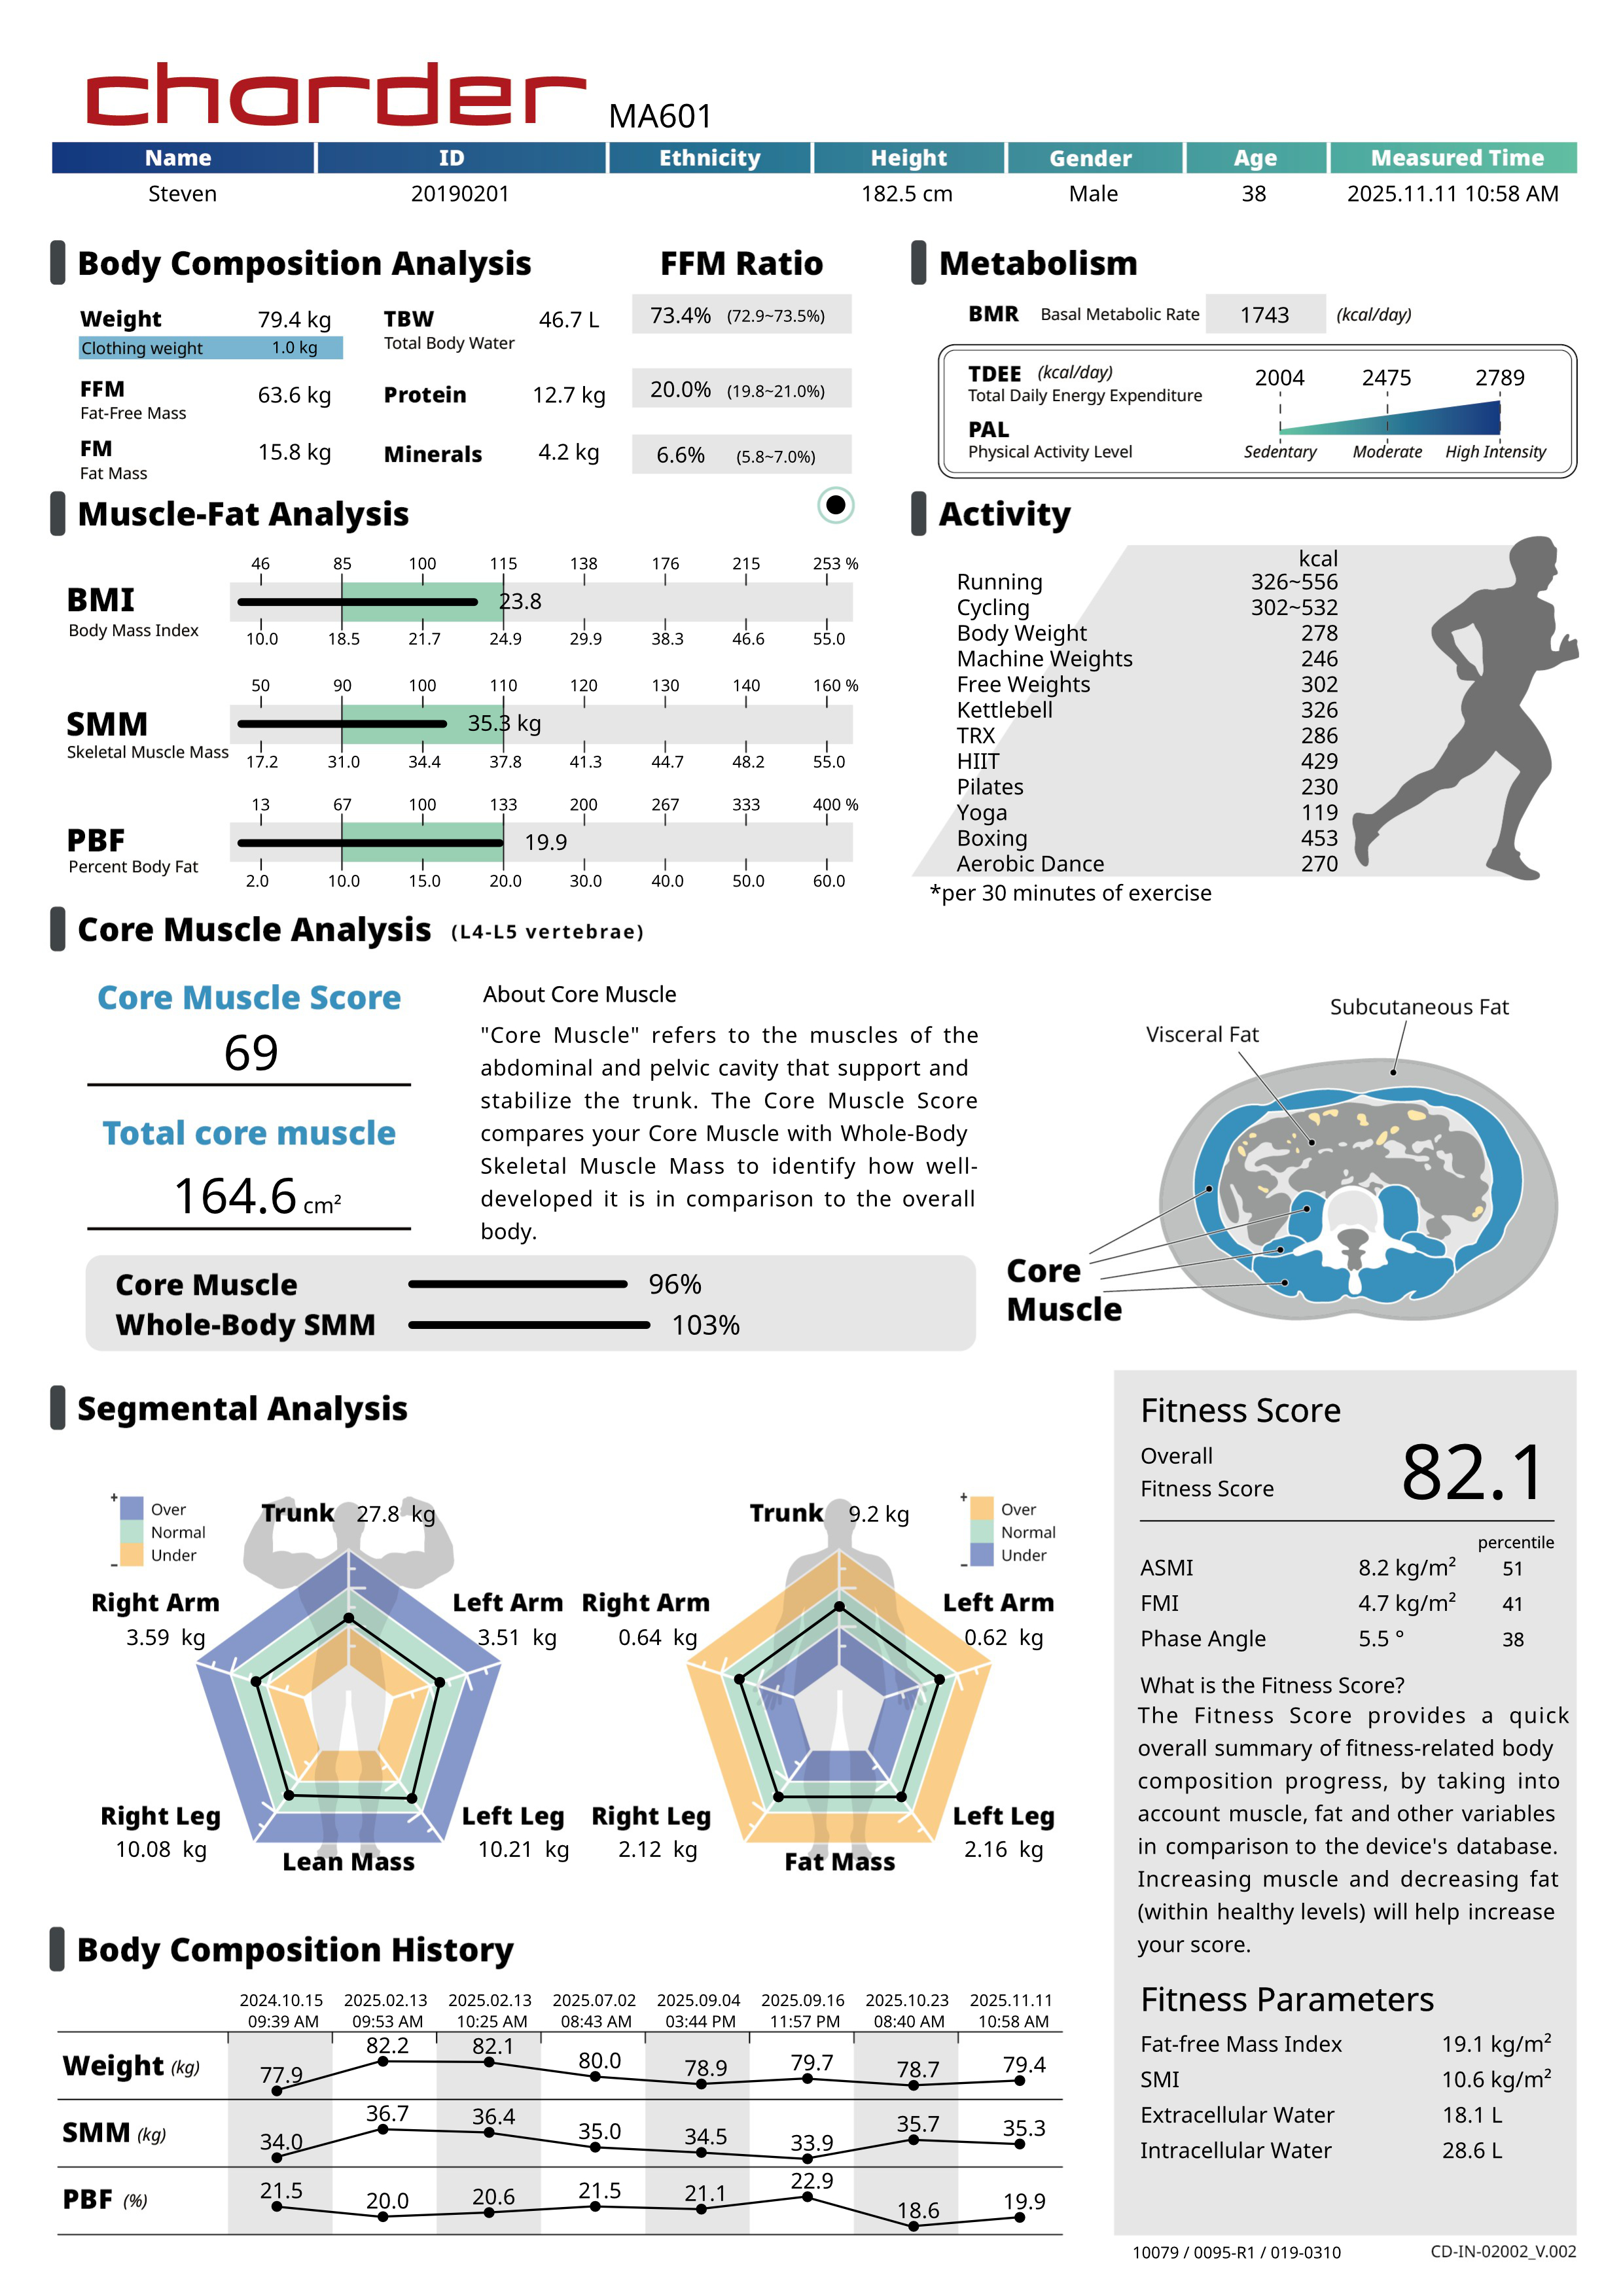
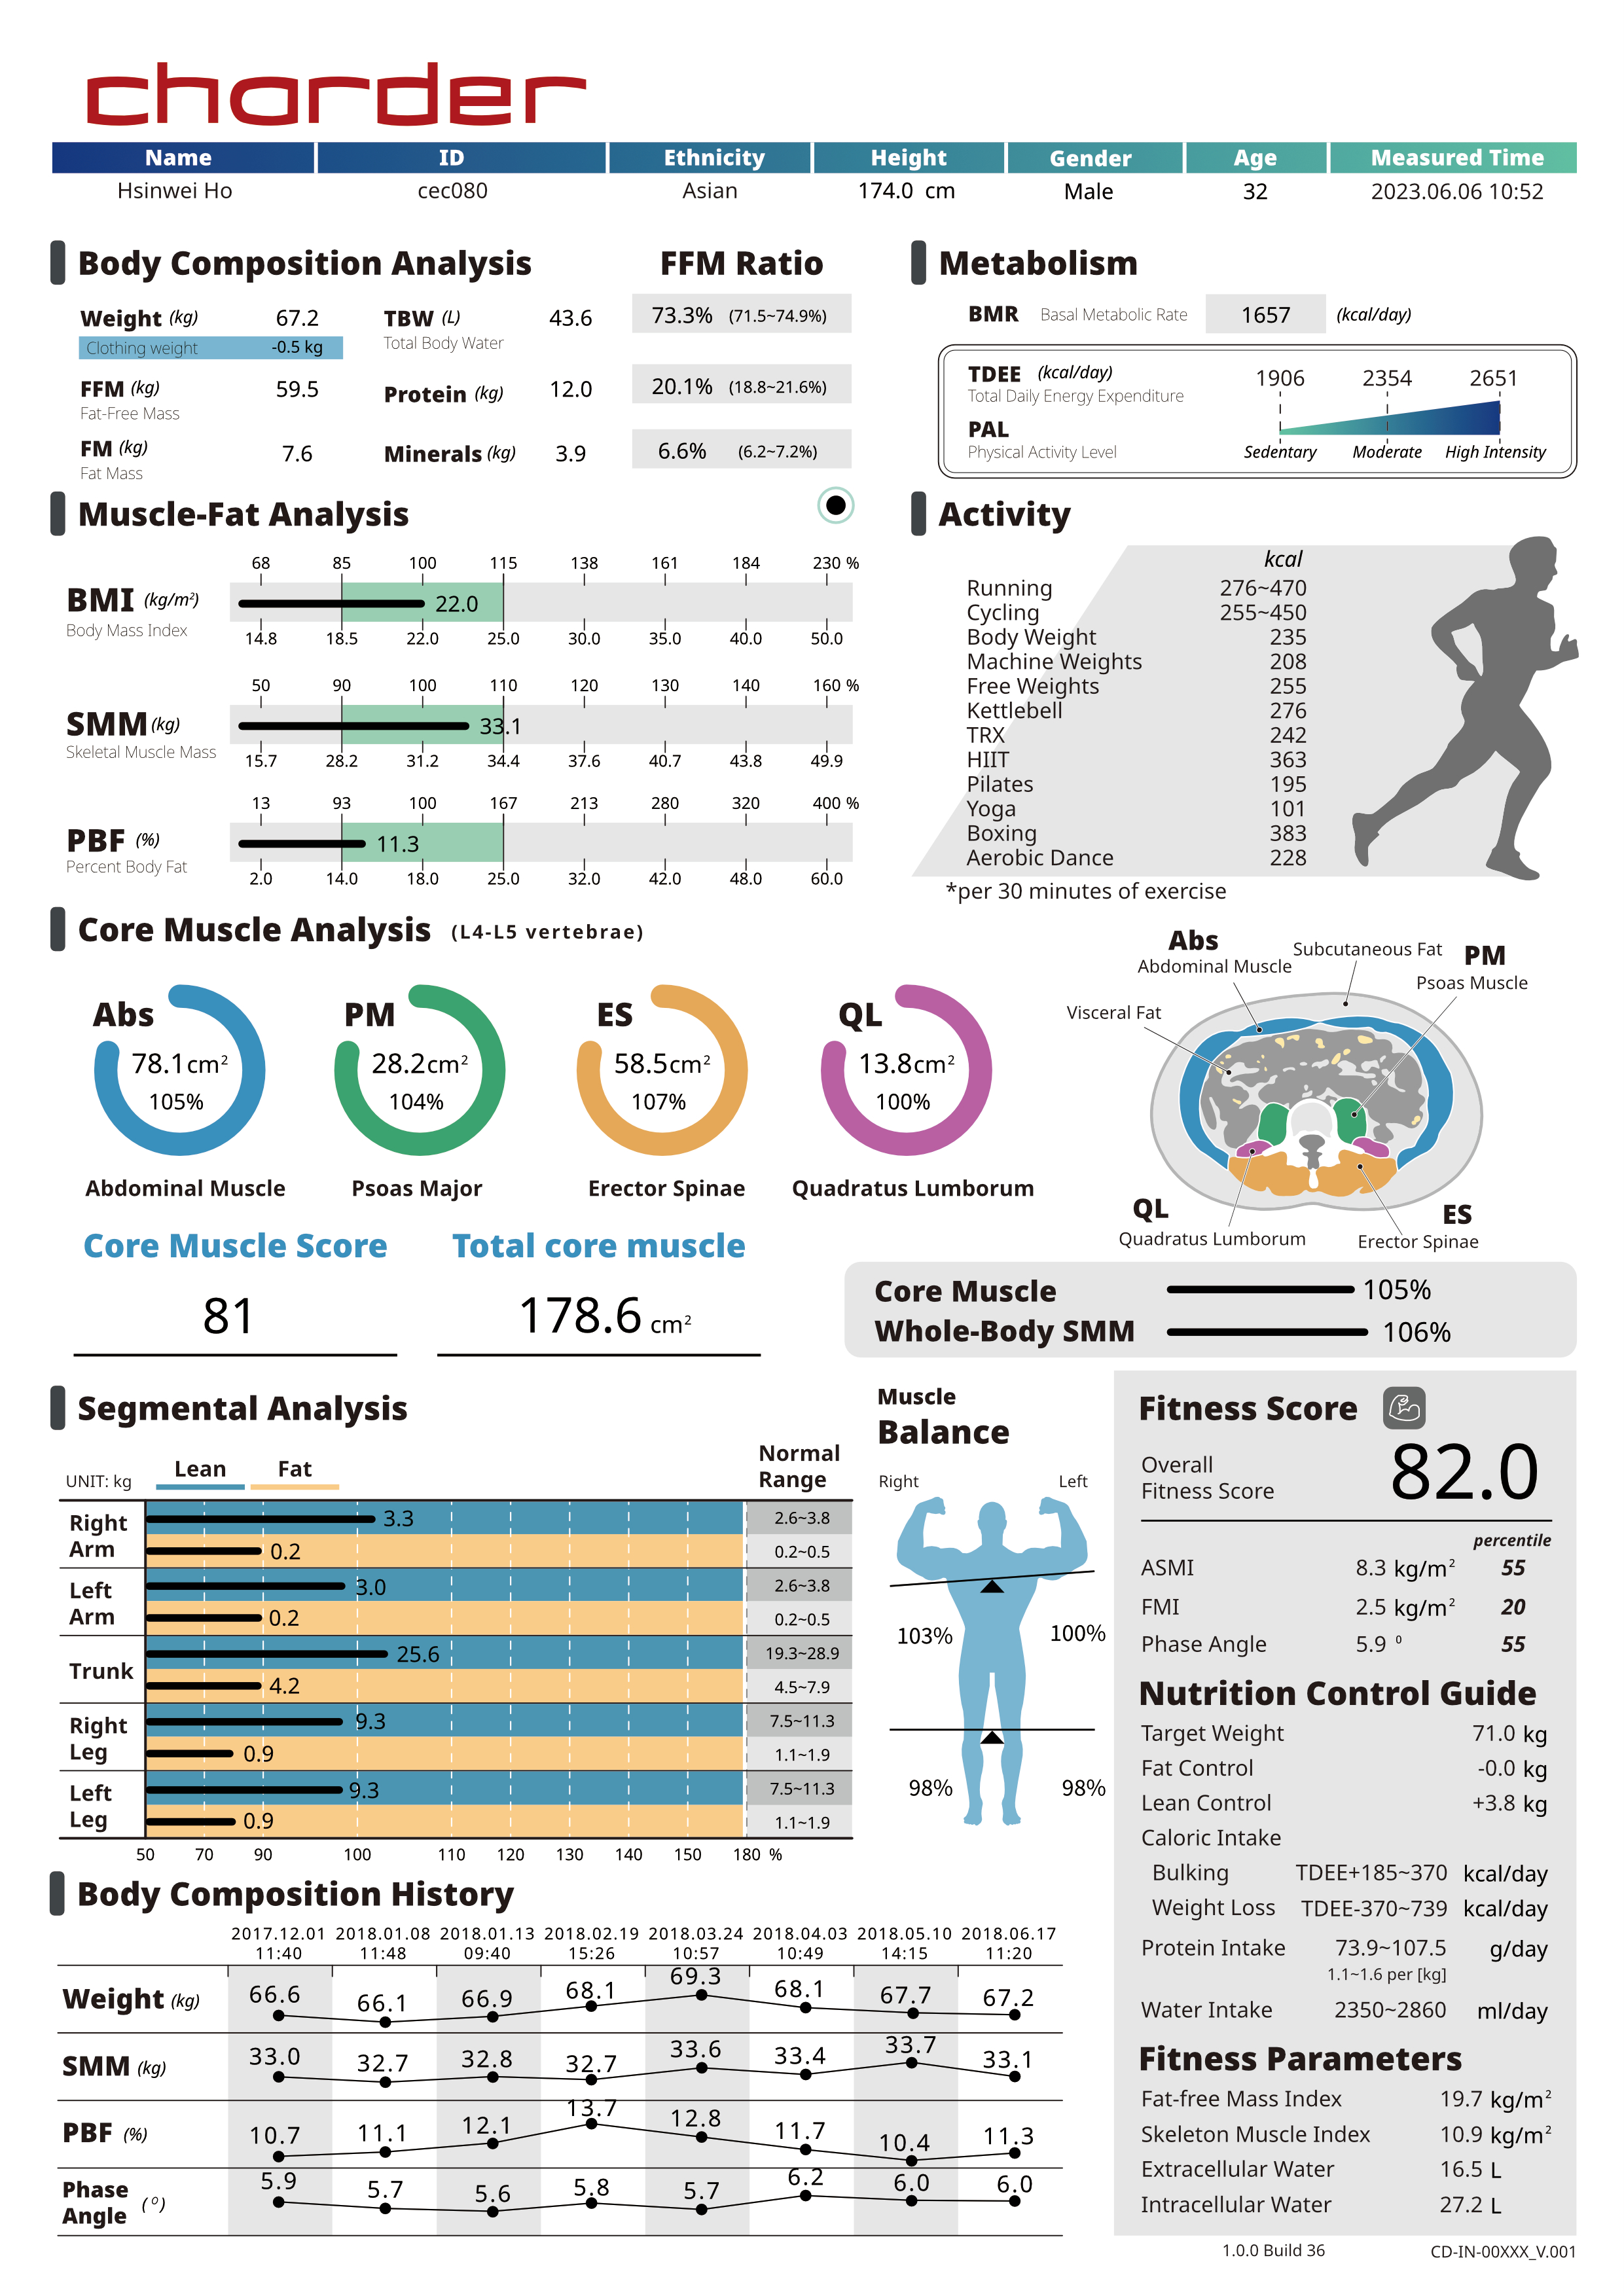
Fitness Result Sheet

Available on MA601

  • (1) Body Composition Analysis

    In the 4-compartment body composition model, body weight is divided into Water, Protein, Minerals, and Fat. Observing which results are changing provides important insight into body composition. For example, Water is highly correlated with muscle mass, and it is common for users with high muscle mass to also have higher body water.

    However, if Water increases but Protein remains relatively unchanged, then it's possible that increase in muscle weight is partly caused by water retention or other factors.

  • (2) Muscle-Fat Analysis

    Observe balance between Skeletal Muscle Mass and Body Fat Percentage. Healthcare professionals can take the subject's Muscle and fat proportions into account to provide suitable advice and guidance.

  • (3) Core Muscle Analysis

    “Core Muscle” refers to the muscles of the abdominal and pelvic cavity that support and stabilize the trunk. Subjects with higher weight and muscle will require a stronger core for overall stability and injury prevention.

    The cross-sectional area (L4-L5 vertebrae) of the core muscles are displayed in cm², compared with a standard physique, and displayed as percentage value.

    Core Muscle Score

    This score provides a quick assessment of core muscle. If score is below 60, we recommend strengthening core muscles to avoid an increased risk of injury due to insufficient abdominal strength. The scoring is based not only on the overall development of core muscle area but also on the comparison between whole-body muscle and core muscle.

    Core Muscle > Skeletal Muscle: higher Core Muscle Score
    Core Muscle < Skeletal Muscle: lower Core Muscle Score
Fitness Result Sheet Available on MA601 Body Composition Analyzer
  • (4) Segmental Analysis

    Loss of lower body muscle is common among subjects at risk for sarcopenia, and insufficient leg muscle can be quickly identified at a glance. In addition, left-right muscle imbalance in particular can increase risk of injury, and early detection is important for preventative training and adjustment of movement.

  • (5) Body Composition History

    A key benefit of Bioelectrical Impedance Analysis is repeatability and lack of side effects, making it easy to follow up consistently and evaluate change in body composition, for evaluation of training, nutrition, and other intervention.

  • (6) Metabolism

    Energy expenditure is calculated based on Basal Metabolic Rate (BMR) and Physical Activity Level (PAL). The Result Sheet provides Total Daily Energy Expenditure (TDEE) for sedentary, moderate, and high intensity PAL. This information is important reference data for calculating ideal daily calorie consumption.

  • (7) Activity

    A chart with how many calories the subject's body would expend (per 30 minutes of exercise) is provided. Results will vary based on the subject's body composition and metabolism! This makes it easier to estimate the effect of training/exercise on overall energy expenditure more precisely.

  • (8) Fitness Score

    The Charder Fitness Score takes into account fitness-related body composition results, primarily (but not exclusively) Muscle, Fat, and Phase Angle.

    As a general rule of thumb, increasing Muscle / Phase Angle will increase the score, while increasing Fat will decrease the score.

  • (9) Fitness Parameters

    Various indexes used as early warning signs for malnutrition, obesity, and sarcopenia.are provided for reference.

    In addition, practitioners can quickly identify abnormalities in intracellular/extracellular fluid proportion, using the edema index as an indicator and warning sign for diseases. Results exceeding the normal healthy range of 0.390 may be an indication of conditions affecting body fluid balance, such as overtraining, swelling, and injury.

Advanced Fitness Result Sheet

Available on MA801

  • (1) Body Composition Analysis

    In the 4-compartment body composition model, body weight is divided into Water, Protein, Minerals, and Fat. Observing which results are changing provides important insight into body composition. For example, Water is highly correlated with muscle mass, and it is common for users with high muscle mass to also have higher body water.

    However, if Water increases but Protein remains relatively unchanged, then it's possible that increase in muscle weight is partly caused by water retention or other factors.

  • (2) Muscle-Fat Analysis

    Observe balance between Skeletal Muscle Mass and Body Fat Percentage. Healthcare professionals can take the subject's Muscle and fat proportions into account to provide suitable advice and guidance.

  • (3) Core Muscle Analysis

    “Core Muscle” refers to the muscles of the abdominal and pelvic cavity that support and stabilize the trunk. Subjects with higher weight and muscle will require a stronger core for overall stability and injury prevention.

    The cross-sectional area (L4-L5 vertebrae) of the four main core muscles are displayed in cm², compared with a standard physique, and displayed as percentage value. A higher percentage reflects better development, identifying relatively less developed muscles to provide targeted guidance/training.

    The four types of abdominal muscle provided are:

    Psoas Major (PM): Overall core strength and stability. It's one of the primary and most important muscles of the hip flexor, crucial in movements bringing thigh towards torso.

    Erector Spinae (ES): Holds the spine upright against force of gravity. Weakness can contribute to poor posture and lower back pain.

    Quadratus Lumborum (QL): Stabilizes the lumbar spine (lower back) during movement and at rest. Helps prevent excessive motion in the lower back, which can contribute to pain and injury.

    Abdominal Muscle (Abs): Stabilizes vertebrae during upright position, forward and backward bending, and twisting postures as well.

Advanced Fitness Result Sheet Available on MA801 Body Composition Analyzer
  • (4) Segmental Analysis

    Loss of lower body muscle is common among subjects at risk for sarcopenia, and insufficient leg muscle can be quickly identified at a glance. In addition, left-right muscle imbalance in particular can increase risk of injury, and early detection is important for preventative training and adjustment of movement.

  • (5) Body Composition History

    A key benefit of Bioelectrical Impedance Analysis is repeatability and lack of side effects, making it easy to follow up consistently and evaluate change in body composition, for evaluation of training, nutrition, and other intervention.

  • (6) Metabolism

    Energy expenditure is calculated based on Basal Metabolic Rate (BMR) and Physical Activity Level (PAL). The Result Sheet provides Total Daily Energy Expenditure (TDEE) for sedentary, moderate, and high intensity PAL. This information is important reference data for calculating ideal daily calorie consumption.

  • (7) Activity

    A chart with how many calories the subject's body would expend (per 30 minutes of exercise) is provided. Results will vary based on the subject's body composition and metabolism! This makes it easier to estimate the effect of training/exercise on overall energy expenditure more precisely.

  • (8) Fitness Score

    The Charder Fitness Score takes into account fitness-related body composition results, primarily (but not exclusively) Muscle, Fat, and Phase Angle.

    As a general rule of thumb, increasing Muscle / Phase Angle will increase the score, while increasing Fat will decrease the score.

  • (9) Nutrition Control Guide

    Suitable level of caloric intake varies depending on if the subject's goal is Bulking (weight/muscle gain), Weight Loss, or Maintenance.

    To effectively use this section, combine data from “Metabolism”. To achieve goals sustainably, weight gain and loss are both set for gradual, rather than rapid change.

  • (10) Fitness Parameters

    Various indexes used as early warning signs for malnutrition, obesity, and sarcopenia.are provided for reference.

    In addition, practitioners can quickly identify abnormalities in intracellular/extracellular fluid proportion, using the edema index as an indicator and warning sign for diseases. Results exceeding the normal healthy range of 0.390 may be an indication of conditions affecting body fluid balance, such as overtraining, swelling, and injury.