The link between Childhood and Adult obesity

According to World Health Organization (WHO) estimates in 2016, more than 650 million adults worldwide were obese - or 13% of the world's adult population (11% of men and 15% of women). Obesity prevalence nearly tripled between 1975 and 2016! Once considered a health problem primarily affecting high-income countries, overweight and obesity is also increasing in low and middle-income countries as well.
Notably, while just under 1% of children aged 5-19 were obese in 1975, by 2016 this had risen to 6% in girls and 8% of boys (124 million). There are considerable factors that have contributed to this rise in childhood obesity around the world, including increased marketing of unhealthy snacks and processed foods, less physical activity, digital entertainment, and increased urbanization.
Scientific models have predicted that the foundations for diet and nutrition in adulthood are oftentimes established during childhood, and obese children are more likely to remain obese in adulthood as well. As such, regular weight checks (and body composition scans, when appropriate) should be part of regular health care checkups, so identify and treat issues early. As a serious but preventable health issue, obesity should be taken seriously and controlled since childhood, to establish a healthier path to adulthood.
Note that unlike for adults, where "normal range" tends to stay relatively consistent throughout life, children change rapidly through adolescence and puberty in particular, and therefore the "normal range" that they should be compared to should be age-adjusted as well!
BMI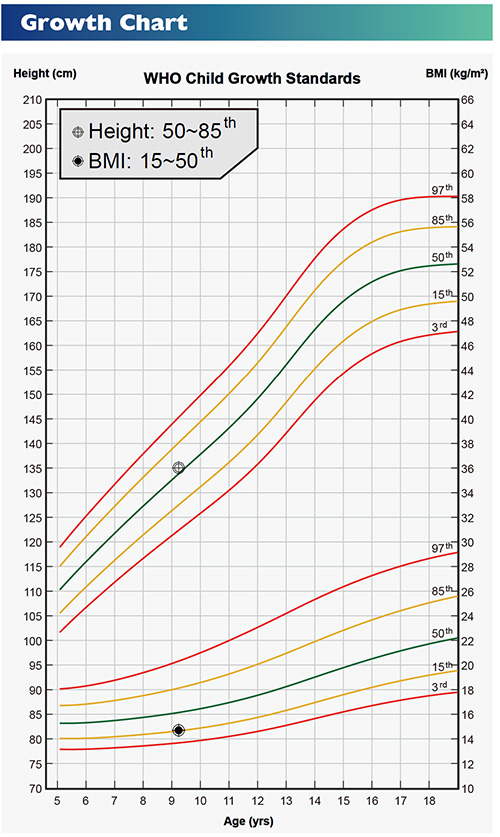
BMI is arguably the most common tool for assessment of obesity. When used by adults, it has its limitations primarily because it does not distinguish between fat and muscle, making it less useful for highly muscular people. However, as most children tend not to have very high amounts of muscle mass, it is generally still reasonably useful for obesity assessment, even if it's not as suitable a tool for adults! As can be seen in WHO Child Growth Standards displayed above for reference, BMI (and height) percentiles for children of different ages can vary significantly.
Growth charts are particularly important for tracking change; a result in the lower percentiles by itself is not necessarily indicative of a growth disorder. (similarly, a result in the higher percentiles is not necessarily a sign of obesity) That being said, if a child's results were originally relatively normal - such as in the 50th percentile - and gradually climb to the 97th percentile, that is a warning sign to take note of.
Body Composition
As you might expect, "normal range" for body composition varies significantly throughout childhood (particular during puberty), just as it does for weight and height. Percentile charts for body fat in particular can vary for children from different countries and ethnicities, and it is recommended to consult a reference chart and compare results with the most similar group to place results in context.
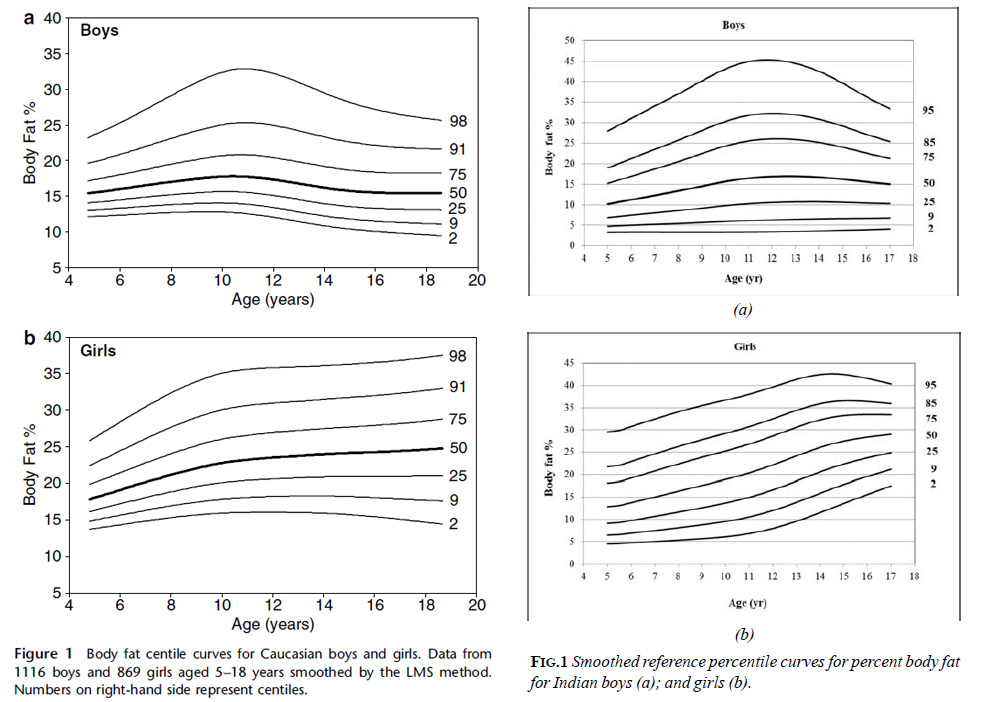
[Left] McCarthy HD, Cole TJ, Fry T, Jebb SA, Prentice AM. Body fat reference curves for children. Int J Obes (Lond). 2006;30(4):598-602. doi:10.1038/sj.ijo.0803232
[Right] Chiplonkar S, Kajale N, Ekbote V, et al. Reference Centile Curves for Body Fat Percentage, Fat-free Mass, Muscle Mass and Bone Mass Measured by Bioelectrical Impedance in Asian Indian Children and Adolescents. Indian Pediatr. 2017;54(12):1005-1011. doi:10.1007/s13312-017-1201-4
As an example, two reference charts from representative research can be seen above. Notice that body fat percentiles for Caucasian children in the UK are somewhat different for Indian children in India.
Some body composition analyzers such as the Charder MA601 and MA801 will automatically take the child's height, gender, age, ethnicity, and other factors into consideration when providing normal range, making it easier to evaluate results, including muscle, fat, body water, and more.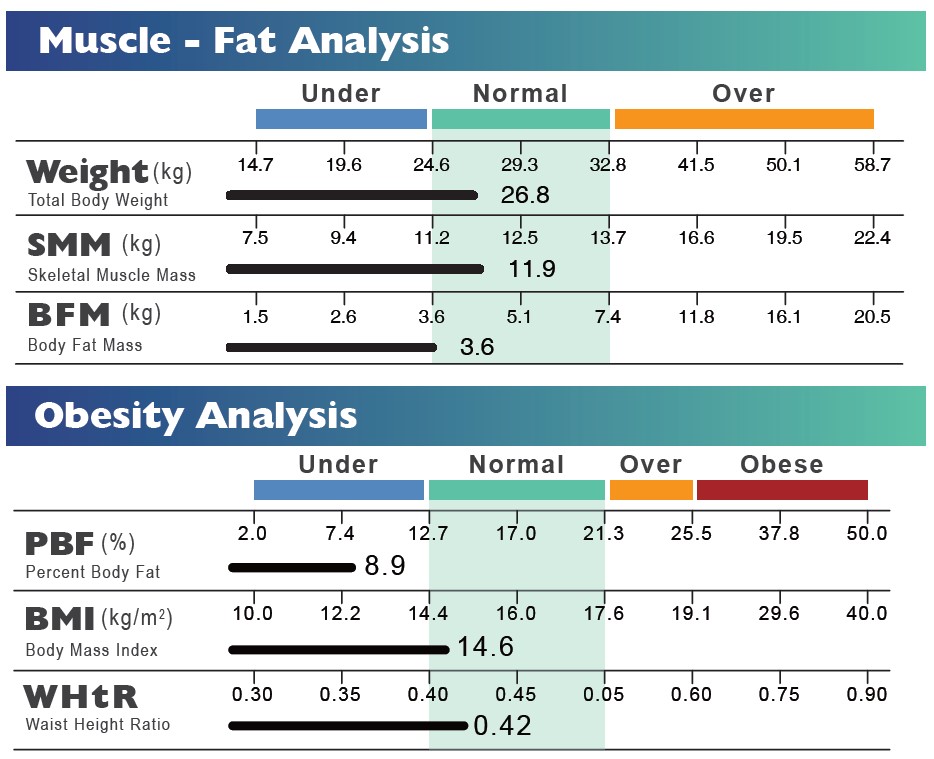
(normal range on the Child Growth Result Sheet will adjust according to different variables)
Regardless of which assessment method is used, placing results in comparative context is necessary to evaluate obesity. Perhaps what's even more important is to remember that fitness and health is a lifelong journey, and that establishing healthy habits can be particularly difficult at first. By providing information in a quantitative and objective way, this makes it easier to track progress and help people stay motivated!